The Moving Average (or MA) is one of the simplest and most popular technical indicators.
The most basic is a Simple Moving Average, or SMA, which is calculated by adding up the prices of an asset or an instrument over a period of time and averaging them.
Another popular indicator is the EMA (Exponential Moving Average) which gives more weight to recent prices.
The time frame of Moving Averages varies between Short Term (stMA), which is calculated over 5, 10, 20 days etc. and Long Term (ltMA) which is calculated over 50, 100, 200 days, etc.
In analyzing charts, this indicator is usually used in several ways:
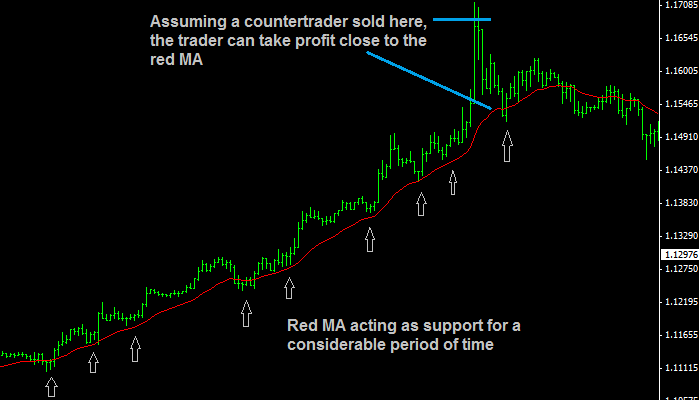
Volatility of price charts creates market noise. MAs help filter noise and identify support and resistance levels. Since they identify support and resistance levels, they can also mark stop loss and take profit levels. In the chart below MA is used to identify the support levels of EURUSD and also mark take profit areas.
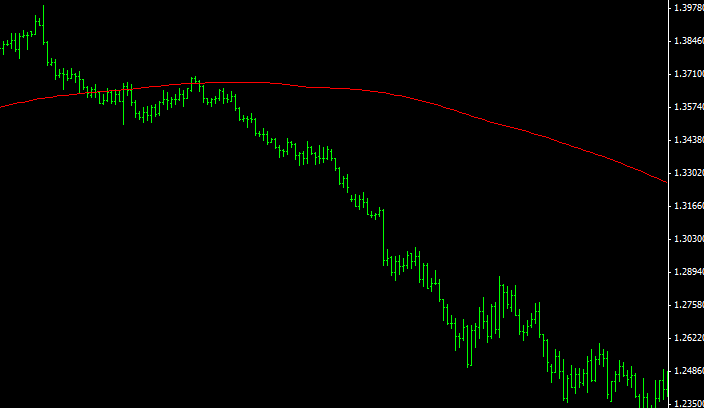
Another popular use of this indicator is the price crossover. In general, when price crosses over an MA line, there is a potential change in price trend. In other words, if price is in an uptrend and crosses over an MA line, especially a long-term line, you can expect a trend reversal. In the following chart, EURUSD price crosses a 200-day SMA and stays below the line for a good amount of time. 50, 100, 200-day SMAs, especially the last two, are considered long-term MAs and quite popular among traders.
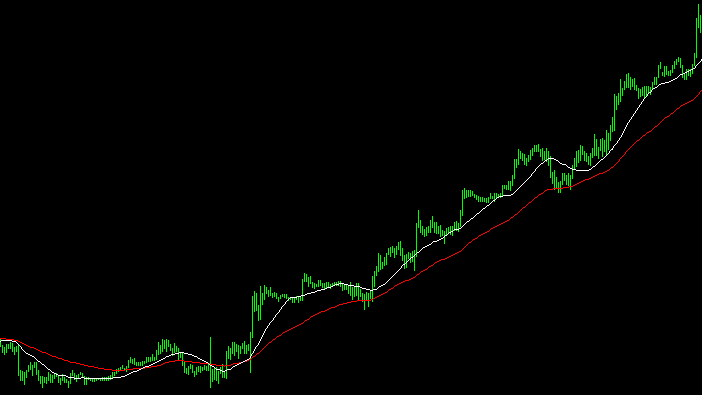
Another variation of a crossover is an MA crossover. Instead of price crossing over an MA, there is a crossover between two MAs. This usually involves a crossover of a short-term (stMA) and a long-term MA (ltMA). The stMA moves more in line with price movement; hence, a stMA crossing over an ltMA can indicate a quick trend change. In the following chart, the stMA (a white 20 SMA) crosses above an ltMA (a red 60 EMA) and stays above it for some time.
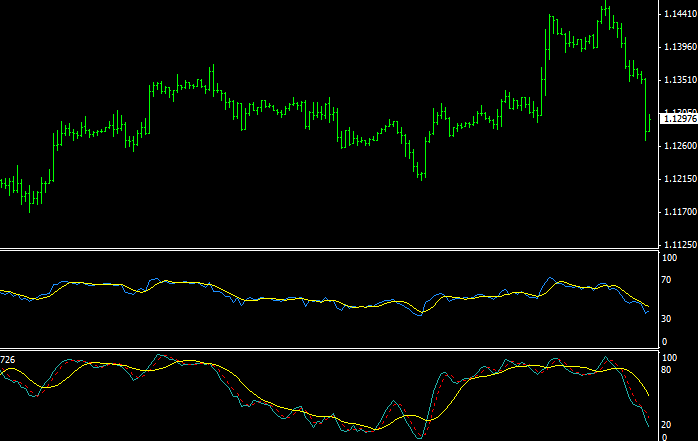
MAs can be overlaid on top of other technical indicators. Just as it can filter out noise in price, it can filter out noise in indicators. In the following chart, a yellow MA is overlaid on RSI (top) and the Stochastic Oscillator (bottom), and shows potentially useful crossover (indicator line crossing over the MA overlay, just like a price crossover).
Get the latest fundamental analyses, technical analyses and the most up to date Forex news catered to your interests.
Sign up for our weekly news and analysis newsletter.