The heart of technical analysis is the use of mathematical and analytical tools. By analyzing past and present price trends and patterns, these tools try to forecast the behavior of a financial asset or instrument in the future (whether a share, a currency pair or an option).
Here is a short introduction to the main and most popular technical analysis tools:
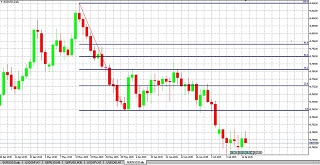
Fibonacci lines are usually used to determine support and resistance levels. These levels are determined in the following method: drawing a trend line between low and high points. Then using horizontal lines to divide the vertical area, created by the trend line, according to the Fibonacci ratios (always: 0%, 23.6%, 38.2%, 50%, 61.8% and 100%.). These horizontal lines indicate support and resistance levels.
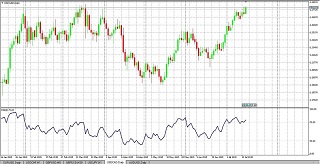
This tool is usually referred to as RSI and was conceived by J. Welles Wilder Jr in 1978. It is an indicator of a market being oversold or overbought, or an asset being overvalued or undervalued. In other words, the price has moved so much in one direction so quickly that a reversal of that trend is expected. The indicator ranges between 01 and 100 when the indicator is below 30 the market is considered oversold and when the indicator is above 70 the market is considered over bought.
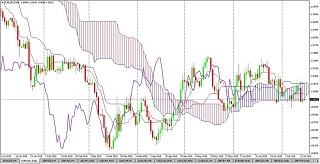
Also known as Ichimoku Kinko Hyo, which means one glance equilibrium chart. Ichimoku Cloud indicators are overlaid on a candlestick chart. Their main feature is the cloud itself which is considered as the equilibrium area, but this tool has 3 more indicators. The cloud and additional indicators are created by using various moving average calculations. The main advantage of the Ichimoku Cloud is that it provides numerous data points in one chart, which allows a more informed, accurate decision making.
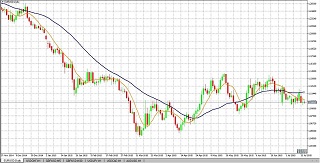
This tool has been around for a long time. It’s mentioned at the beginning of the 1900s in literature and is thought to have been used long before. Moving Averages smooth out the prices for a given period and create an average of price for a given number of days or periods. Prices above or below this average can give clues as to where the market is heading. Usually more than one line is used, each line being calculated over different periods. A fast line has a smaller number of days, like 8, and a slow line has a larger number of days, like 34. When the fast line crosses below or above the slow line a sell or buy signal is created respectively.
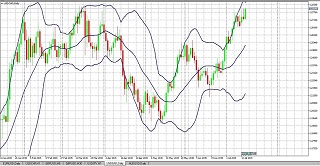
John Bollinger, author and financial analyst, came up with this tool in the 1980s. These bands use the volatility of a Forex pair along with a Moving Average over a number of days to create a high and low price range. The bands are then used to predict points from which price will move back towards its equilibrium.

This indicator was also developed by J Welles Wilder JR and uses 3 lines; Average Divergence Index (ADX) and Divergence up (D+) and Divergence down (D-) lines. The ADX line indicates the strength of the current trend; the D+ above D- or vice versa indicate whether the trend is up or down.
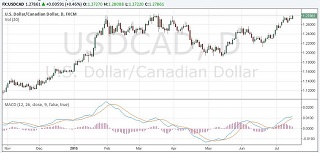
Pronounced “mack-dee”, this indicator was developed by the well-known Technical Analyst Gerald Appel. It uses two moving averages to create a single Main average line. Then it calculates the moving average of that line to create a “trigger” line. When this line crosses below or above the Main average line a signal to sell or buy is produced.
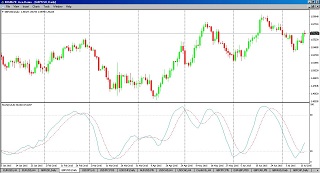
This tool was developed by George Lane in the 1950s. As the name suggests it indicates points of reversal as the market oscillates up and down whilst moving in a given direction. It is made of two lines that compare the current price with the high and low of a set number of periods, most commonly 14. This could be 14 days on a day chart or any other period on intraday. The lines lie between 0 and 100 and an upward crossover of the two lines from below 20 indicates a possible upward move and a downward crossover from above 80 may indicate a downward move. Lines above 80 and below 20 also indicate the market is beginning to reach overbought and oversold territory.
Get the latest fundamental analyses, technical analyses and the most up to date Forex news catered to your interests.
Sign up for our weekly news and analysis newsletter.