EUR/USD spot: 1.1183
Support: 1.1160, 1.1073, 1.0875
Resistance: 1.1268, 1.1326, .1.1366
Strategy:
The Euro/Dollar pair traded in a tight range last week, failing to fall as far as our first buying level at 1.1121. The pair did break our first resistance level at 1.12 but soon lost momentum. This consolidation indicates indecision in the market with very little data to drive sentiment. The only interesting news last week was Angela Merkel’s speech where she said she thought the Euro was too weak.
Today is a holiday in China, the UK and US, so the week will get off to a slow start with little volatility. Tomorrow and on Wednesday we may see some month-end flows and a test of either the high or low of last week’s range.
Later in the week, we will see US employment data which will be key in determining if a June rate hike by the Fed is likely to happen or not. If the data does support a rate hike, that may be the catalysts for a deeper correction to somewhere between 1.06 and 1.10. On the other hand, if the data support the Fed holding rates steady we may see a new up leg for the Euro. Donald Trump is back in the US, and we may see the scandals surrounding him intensify – this would be bad for the USD.
As we said last week, the large range is now from 1.05 to 1.16. This market seems to be respecting the weekly peaks from last year and is likely to keep targeting these levels and then consolidating. It’s unlikely we will see a strong bullish move toward 1.14 and then 1.16, but rather a series of small rallies with minor corrections in between.
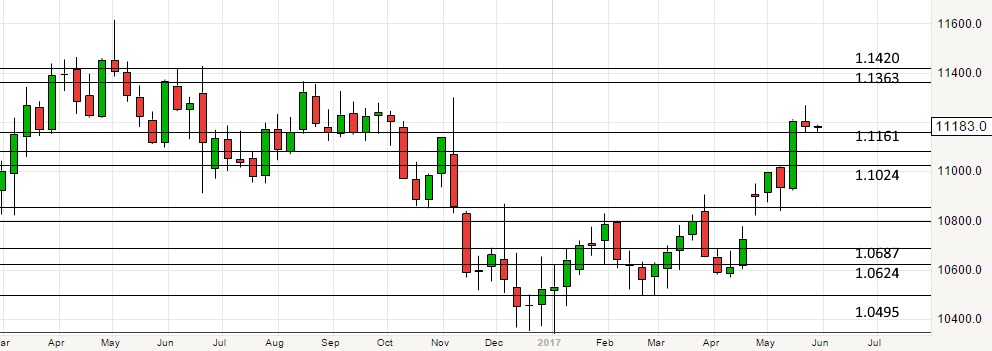
EUR/USD Weekly Chart
Last week’s action may have been a ‘correction through time’ before a continuation, or it may have been setting up a top for a bigger correction.
On the upside, if the market was to test 1.1268 and not see significant selling it will probably target the next peak from late last year at 1.13, and then the zone between 1.1326 and 1.1366.
If it breaks to the downside, we may see a larger corrective pattern forming, possibly back to 1.10.
In the very short term traders may wish to target short trades, but be careful not to lose sight of the bigger picture and opportunities to go long.
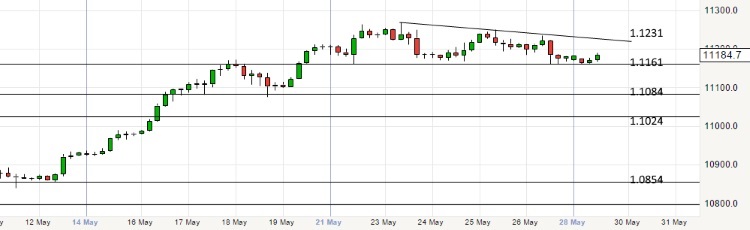
EUR/USD 4-Hour Chart
Get the latest fundamental analyses, technical analyses and the most up to date Forex news catered to your interests.
Sign up for our weekly news and analysis newsletter.