EUR/USD spot: 1.1380
Support: 1.13, 1.1288, 1.1166
Resistance: 1.1428, 1.1446, 1.1615
Strategy:
Long term traders holding long positions should move their stop loss to 1.1280.
The Euro Finally broke out of the consolidation pattern, proving it was indeed a bull flag. The move came on the back of Mario Draghi’s comments in which he said the ECB’s policies were working and would bring inflation back to the Eurozone. He also said the ECB would eventually be able to end their quantitative easing strategy and raise rates. Janet Yellen also made some remarks, though her comments were overshadowed by Draghi’s.
The Euro broke higher on Tuesday and there was a very brief retest on Wednesday, though most of the market probably missed it. We took profits on our long trade, and we are waiting for a new entry point.
Donald Trump has managed to stir things up again, both on Twitter and in his comments about the healthcare bill. If anything, this will weigh on the USD, though traders will be cautious until after the 4th of July holiday. On Wednesday, the minutes from the FOMC meeting will be released and traders will study them carefully.
Now that 1.13 has been broken, the technical levels will become important once again. The news flows these days tends to be USD negative and Euro positive, but anything could happen.
The weekly chart has a clear target in the 1.16 to 1.1615 zone. That will mark the top of the range, and what happens after that would be anyone’s guess. On the other hand, market sentiment amongst traders is generally bearish for the Euro over the medium to longer term. That may explain last week’s rapid move, as traders were squeezed out of short Euro positions.
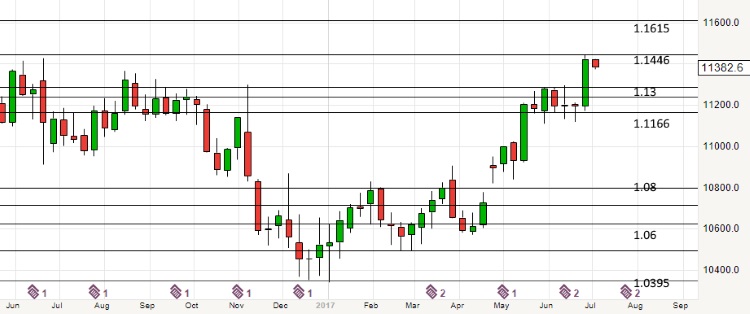
EUR/USD Weekly Chart – Bull Flag Breakout
The shorter-term chart has developed a lower high at 1.1428. This makes a retest of the 1.13 level very plausible. A lot of traders have probably missed this rally and will be waiting for a retracement. So, the pullback should see aggressive buying – and if it doesn’t that would be a bearish sign.
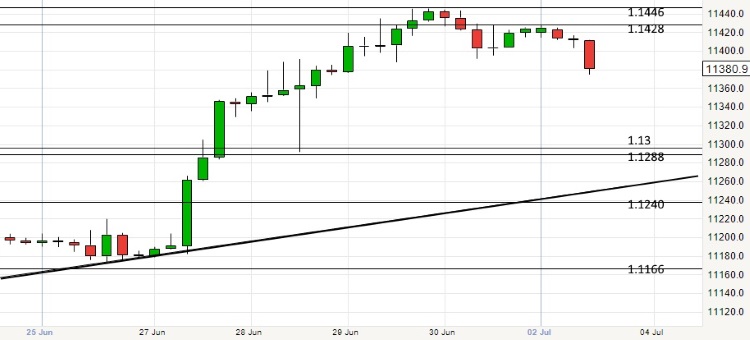
EUR/USD 4-Hour Chart – A pullback to 1.13?
Get the latest fundamental analyses, technical analyses and the most up to date Forex news catered to your interests.
Sign up for our weekly news and analysis newsletter.